Optimize your business results: A guide to Bright SDK analysis tools
Are you looking to optimize your business results through the Bright SDK? As part of our partner program resources, you can now use our funnel and retention analysis tools to better understand how users interact with your app, improve user engagement, and maximize revenue. In this guide, we will walk you through how to use […]

Are you looking to optimize your business results through the Bright SDK? As part of our partner program resources, you can now use our funnel and retention analysis tools to better understand how users interact with your app, improve user engagement, and maximize revenue. In this guide, we will walk you through how to use Bright SDK’s powerful analytics tools, to get the most out of your app integration. So let’s dive in and boost your app’s monetization with data-driven insights.
Funnel Analysis
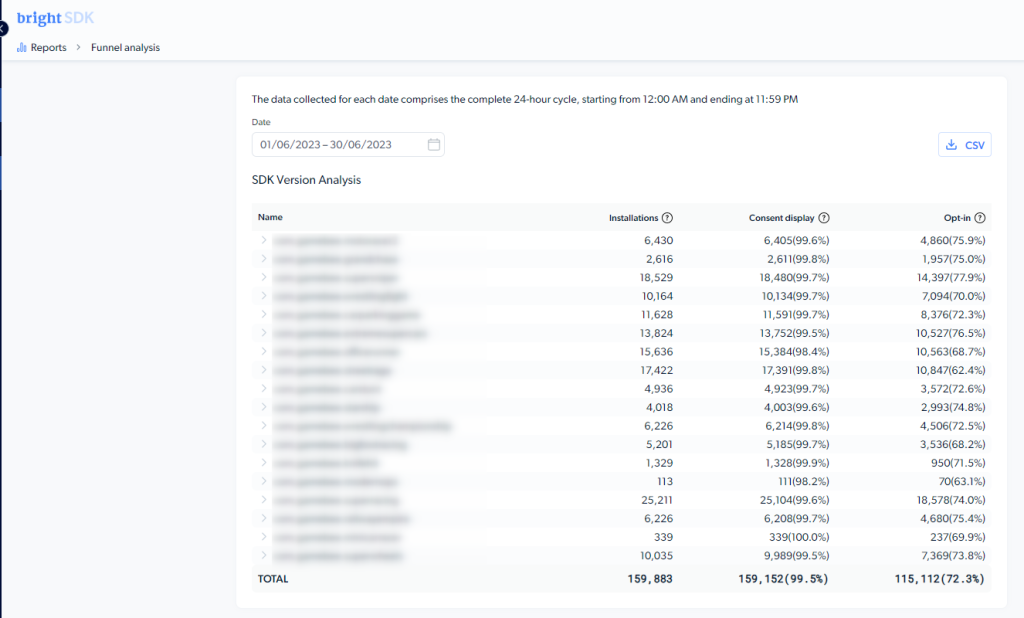
The Bright SDK funnel analysis tool helps you identify users behavior during the install and opt-in process, and take action to maximize conversions. With this data, you can identify what steps are working well and which ones need improvement.
The report includes three main events, all per a selected range of dates:
- Installations: The number of installations detected by Bright SDK
- Consent Display: The number of times the Bright SDK dialogue (consent screen) was displayed to users.
- Opt-in: The number of times users opted-in to Bright SDK from the consent dialog (accepted the offer)

After selecting a range of dates, you should see results, in both numbers and percentages, per each one of your live apps, as well as a summary average line.
Here are some examples of action items that can be driven based on funnel analysis:
- Identify an app that has lower results compared to the average, and understand what it does differently.
- Low consent display rate (thumb rule- lower than 80%):
- Rethink the app flow. When do you present the consent screen? compare it to average usage time to make sure most users will have a chance to see it at least once.
- When is the next time you display the consent screen, for users who did not accept the initial offer? Some examples can be: as part of the app shop, after a few levels are complete, after the next ad is presented, etc. Remember, you only need to get the opt-in once!
- Low opt-in rate (typically, should be at least 60%):
- Do you use your own custom design or the standard that is included in Bright SDK? In most cases, a custom designed consent screen that fits the app UI will generate higher conversion.
- What value do you provide users who opt-in? The higher it is perceived, the more users will accept the offer. True, you can just ask them to “support the app developer”, but tangible value such as seeing fewer ads, opening new game levels, earning more coins, etc will be more appealing and increase the conversion rate.
- SDK version: Bright SDK devoted R&D team keeps working constantly on releasing new SDK versions that will improve stability and solve any minor bug reported to us. By clicking on the expand icon next to each app you will see a breakdown per SDK version integrated. It is always recommended to use the latest SDK versions for maximum revenue.
Retention Analysis
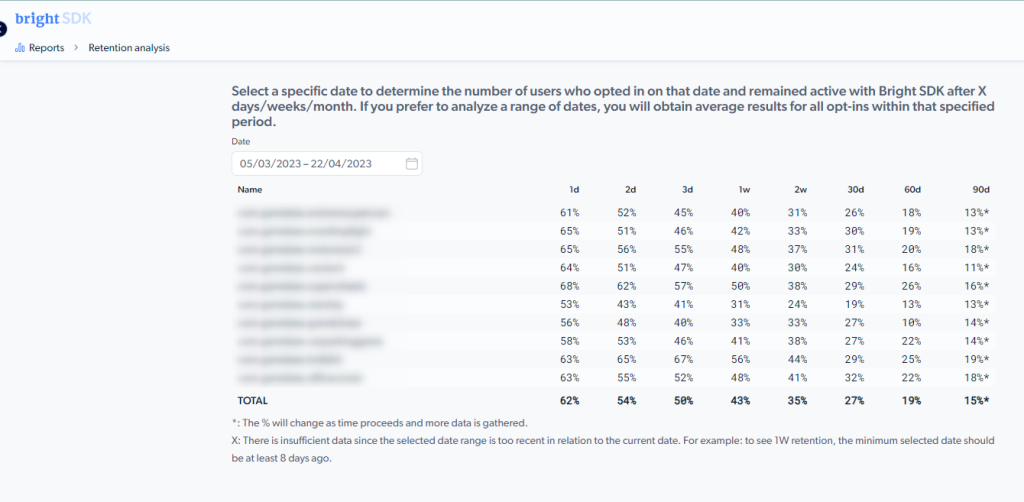
Retention analysis with Bright SDK allows you to see how many users remain active after they first opted-in, after X number of days. As an app developer, knowing who’s sticking around and who isn’t is essential for optimizing user experience and increasing lifetime value (LTV).
There is one point important to emphasize here. Bright SDK retention is not identical to actual app usage retention. To clarify how we calculate retention: as Bright SDK, we cannot really tell if a user ever launched your app or not, and for how long. We just know if they were connected to our network at any point in time, i,e “Active device” on the Bright SDK network. In most operating systems (Windows, Android, WebOS LG)- it simply means that a user has opted in, has not opted-out or uninstalled the app, and their device was online when we checked. Even if the app was not in use, they would still count as an active Bright SDK device and be paid for. In some operating systems that do not allow background processes (iOS, Roku) they do need to be using the app on the chosen date, for a minimum number of minutes as set in our partnership agreement.

Here are some examples of action items that can be driven based on funnel analysis:
- Retention can only go down over time. The more time passes since the initial opt-in, there is always a drop in retention percentage. Having said that, you can still compare results between different apps, and ask our team for benchmarks. That helps you identify pain points and handle them.
- Based on the number of days in which you see users still active, plan your communication strategy. Example: after 30 days- offer a free gift, to keep users engaged with your app.
- Compare our retention analysis to your own analysis, which should typically monitor actual app usage:
- If you see that your retention is higher than ours: users like your app and use it, but don’t stick to Bright SDK offer. Perhaps, for example, they decide to opt-out. Consider improving the value you provide them in exchange for their opt-in.
- If our retention results are higher than yours (the usual scenario): you are doing well in terms of monetization, and keep earning even for users who don’t use the app that often. You can still consider improving the app UX, to keep them engaged for the long run.
Time To Take Action!
Start leveraging Bright SDK’s powerful analytics tools today! You will find both tools under “Reports” on Bright SDK dashboard.

The tools were designed to be self explanatory, but you are always welcome to consult with our partnership team, that has lots of experience working with a variety of apps in different platforms.
We welcome you to contact us for any further assistance, share your thoughts or get some advice. Reach out to us at [email protected]!
